Project
Production systemAI-Driven Analytics Dashboards
Analytics product · Live KPIs & AI assist
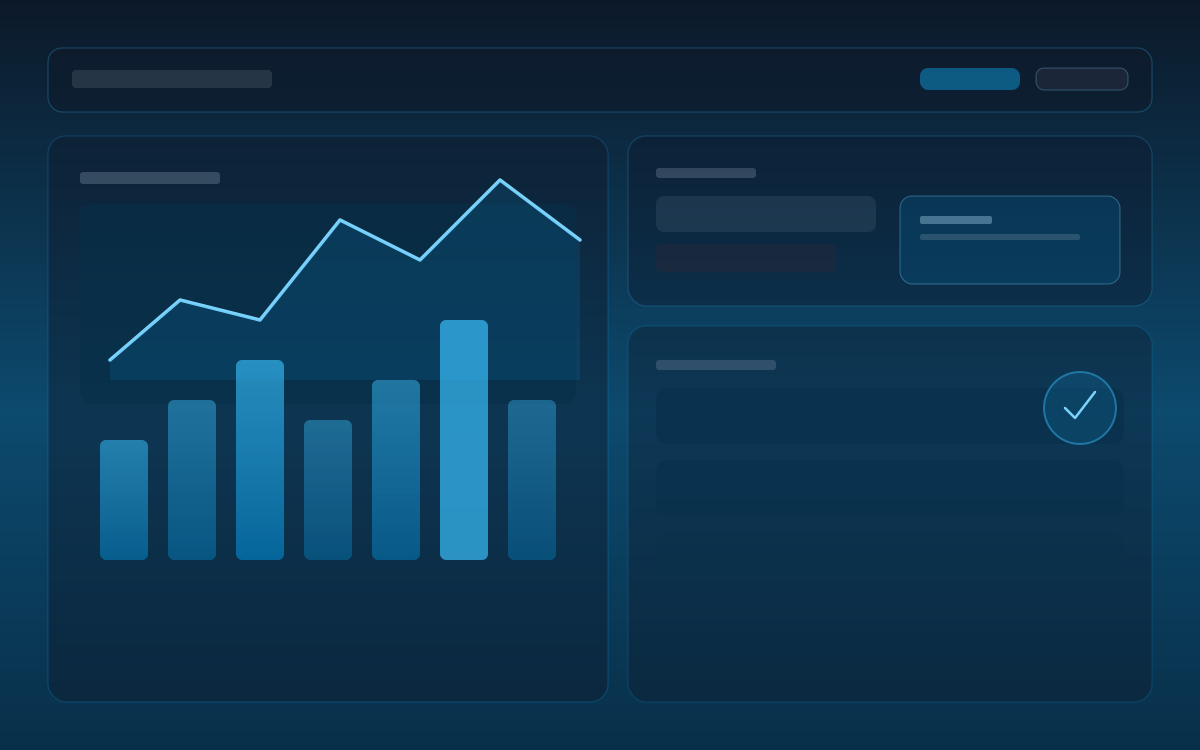
Live operational dashboards with multi-source aggregation and an AI panel for summaries and anomaly hints.
Problem
Stakeholders relied on static exports and spreadsheets, delaying operational decisions and hiding trends.
Solution
React dashboards with filterable KPI modules, aggregation APIs, and an AI panel for anomaly hints.
Result
KPI reviews got faster, manual reporting dropped, conversations shifted from 'where is the number?' to decisions.
What it does
- Interactive dashboards with filterable KPI modules
- Aggregation APIs that normalize multiple upstream sources
- Transforms and trend pipelines with precomputed hot paths
- AI side panel for summaries and anomaly hints without clutter
Overview
Stakeholders were living in static exports and one-off spreadsheets, which delayed operational decisions and hid trends until someone manually refreshed a report. The ask was interactive dashboards that stay current and reduce the cognitive load of scanning raw KPIs.
I implemented a React front end with filterable KPI modules, an aggregation API that normalizes multiple upstream sources, and a pipeline for transforms and trend calculations. High-traffic views use precomputed aggregates; resilient fallbacks prevent empty states when a source blips. A side AI helper summarizes what changed and surfaces anomaly hints using progressive disclosure so dense analytics stay readable.
KPI reviews got faster, manual reporting work dropped, and conversations shifted from "where is the number?" to "what should we do about it?"